Showing posts with label Trading Glossary. Show all posts

Friday, March 6, 2020

Non-Production Data Feed

Non-Production Data Feeds are designed to only provide data to populate price charts and other key data related activities. Order entry through these feeds do not exist but typically will provide the best unfiltered data available. A good example of that would be the feed provided by DTN IQ Feed.

This is a trading glossary term series of blog posts. You can take a look at all the terms we post with the Trading Glossary label.

Also, visit our Trading Community to learn more about our indepth top down analysis process and trading methodology based on the auction market theory and other closely related nuances.


Thursday, March 5, 2020

Over Night High And Low - Trading Glossary

ON High is abbreviated for the overnight high or the high that occurred in the non-regular trading hours/globex session. ON Low is the abbreviation for the overnight low that occurred in the non-regular trading hours/globex session.


This is a trading glossary term series of blog posts. You can take a look at all the terms we post with the Trading Glossary label.

Also, visit our Trading Community to learn more about our indepth top down analysis process and trading methodology based on the auction market theory and other closely related nuances.

Wednesday, March 4, 2020

Open Rejection Reverse - Trading Glossary

Open Rejection Reverse is when the market opens and auctions in one direction to only be quickly rejected and reverses the other direction. This is very similar in appearance to an Open Test Drive (OTD).


This is a trading glossary term series of blog posts. You can take a look at all the terms we post with the Trading Glossary label.

Also, visit our Trading Community to learn more about our indepth top down analysis process and trading methodology based on the auction market theory and other closely related nuances.

Tuesday, March 3, 2020

Pullback Low/Rally High - Trading Glossary

Late in the afternoon on a trend day price migration against the prevailing trend. During the afternoon there is one inventory adjustment. On the next session the pullback high or low is used to see if there is any change to the previous day; if the pullback high/low is not taken out this shows no change in directional conviction and becomes support.


This is a trading glossary term series of blog posts. You can take a look at all the terms we post with the Trading Glossary label.

Also, visit our Trading Community to learn more about our indepth top down analysis process and trading methodology based on the auction market theory and other closely related nuances.

Monday, March 2, 2020

Reversion to the Mean - Trading Glossary

A Reversion to the Mean can be looked at as an inventory adjustment that will occur in the later part of a trading session. This can be the result of intra-day traders liquidating their long positions or covering their short positions depending on what the market was doing that day. A reversion to the mean trade will always be targeted and is best taken when the market comes back into the day's developing value with a target at the VWAP or DPOC.


This is a trading glossary term series of blog posts. You can take a look at all the terms we post with the Trading Glossary label.

Also, visit our Trading Community to learn more about our indepth top down analysis process and trading methodology based on the auction market theory and other closely related nuances.

Friday, February 28, 2020

Open Auction Out of Range (OAOR)

Open Auction Out of Range (OAOR) is an open above or below the previous session's range (gap).


This is a trading glossary term series of blog posts. You can take a look at all the terms we post with the Trading Glossary label.

Also, visit our Trading Community to learn more about our indepth top down analysis process and trading methodology based on the auction market theory and other closely related nuances.

Thursday, February 27, 2020

Repair - Trading Glossary

Repair is a process in which the market will revisit an area on a profile which lacks symmetry. It is not uncommon to see the market “clean” these areas up. Most times we refer to this process as filling low volume or time areas with volume and time.

Another version of repair is to fill the "empthy" levels (0x0 auctions) of the Footprint once the market sold off or surged higher quickly. Also empty gaps in the lower timeframes after a flash move tend ot be revisted and repaired/filled.


This is a trading glossary term series of blog posts. You can take a look at all the terms we post with the Trading Glossary label.

Also, visit our Trading Community to learn more about our indepth top down analysis process and trading methodology based on the auction market theory and other closely related nuances.

Wednesday, February 26, 2020

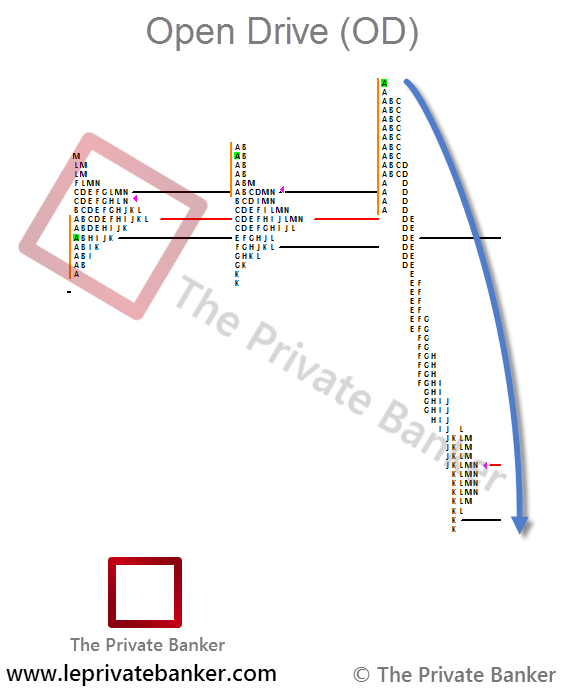
Opening Drive or Open Drive - Trading Glossary

Opening Drive is when the market opens and immediately auctions in one direction without taking out the opening print level. This is the sign of an imbalanced market. However, there is a higher probability in various markets to take out that opening print level later in the trading session.


This is a trading glossary term series of blog posts. You can take a look at all the terms we post with the Trading Glossary label.

Also, visit our Trading Community to learn more about our indepth top down analysis process and trading methodology based on the auction market theory and other closely related nuances.
Tuesday, February 25, 2020

Naked Point of Control (NPOC)

A Naked Point of Control is an untested point of control, either time based or volume based, that is existent in the current market structure. These can serve as excellent targets for trades as well as potential areas of support and resistance dependent upon the NPOC's profile distribution.


This is a trading glossary term series of blog posts. You can take a look at all the terms we post with the Trading Glossary label.

Also, visit our Trading Community to learn more about our indepth top down analysis process and trading methodology based on the auction market theory and other closely related nuances.

Monday, February 24, 2020

Excess - Trading Glossary

Excess indicates the end of one auction and the start of a new auction. It is visible through buy-ing and selling tails (single TPO prints). Excess occurs in all timeframes; it completes an auction. There are always multiple two-way auctions at work; one could be completed while another is still active. As was previously mentioned, balance and excess are the two most important concepts you will be introduced to because they show change or the possibility for change to take place.


This is a trading glossary term series of blog posts. You can take a look at all the terms we post with the Trading Glossary label.

Also, visit our Trading Community to learn more about our indepth top down analysis process and trading methodology based on the auction market theory and other closely related nuances.

Monday, October 19, 2015

Gap - Trading Glossary

A Gap is a form of excess. It shows that the market is out of balance and there is great oppor-tunity to which ever direction the marketed gapped up/down in. Also, gaps in the market are potential areas to be revisit in order to fill it.


This is a trading glossary term series of blog posts. You can take a look at all the terms we post with the Trading Glossary label.

Also, visit our Trading Community to learn more about our indepth top down analysis process and trading methodology based on the auction market theory and other closely related nuances.

Tuesday, October 13, 2015

Exponential Moving Average - Trading Glossary

EMA is an abbreviation for the Exponential Moving Average. An Exponential Moving Average (EMA), also known as an exponentially weighted moving average (EWMA),[3] is a type of infinite impulse response filter that applies weighting factors which decrease exponentially. The weighting for each older datum point decreases exponentially, never reaching zero.

This moving average is far more dynamic in its engagement with the market than most other moving averages and can provide very clear levels of support and resistance as well as ongoing market context


Learn more about how we use Moving Averages in our Top Down Technical analysis process here.

This is a trading glossary term series of blog posts. You can take a look at all the terms we post with the Trading Glossary label.

Also, visit our Trading Community to learn more about our indepth top down analysis process and trading methodology based on the auction market theory and other closely related nuances.

Standard Deviation - Trading Glossary

Standard Deviation is a measure of the dispersion of a set of data from its mean. The more spread apart the data, the higher the deviation. Standard deviation is calculated as the square root of variance. This concept applies to many aspects of Auction Market Theory.


This is a trading glossary term series of blog posts. You can take a look at all the terms we post with the Trading Glossary label.

Also, visit our Trading Community to learn more about our indepth top down analysis process and trading methodology based on the auction market theory and other closely related nuances.

Thursday, October 8, 2015

High Volume Node / Low Volume Node - Trading Glossary

A High Volume Node is an area of prior acceptance as represented with a high amount of volume that occurred at or around this level.This distribution should be much more prominent then the surrounding volume distributions.


A Low Volume Node is an area where very little volume was able to be transacted. This represents a past area of rejection.


This is a trading glossary term series of blog posts. You can take a look at all the terms we post with the Trading Glossary label.

Also, visit our Trading Community to learn more about our indepth top down analysis process and trading methodology based on the auction market theory and other closely related nuances.

Iceberg Order - Trading Glossary

An Iceberg Order is a large single order that has been divided into smaller lots, usually through the use of an algorithmic program, for the purpose of hiding the actual order quantity. This order type is often used by a large institutional traders.

Synthetic Orders can be best described as orders that are generated from a computer algorithm. The most commonly used synthetic order would be an
Iceberg Order. This is best used by a trader looking to put a very large order into the market but looking to be discreet about it. An example would be, trying to buy 1,000 ES contracts at a certain price but only showing that you want 100. As soon as that 100 is filled, another 100 will appear and continue to do this in succession until filled.

Other synthetic order types include TWAP (Time Weighted Average Price) also known as a Time Slice order and VWAP (Volume Weighted Average Price). The TWAP execution is a set of orders being executed over a period of specified time at the closest average price for that period. These orders can be passive and they can be aggressive depending on the situation. Also, similar to an Iceberg order, the order only shows a certain amount of contracts to execute and keeps reloading that number by each specified time period. This can be spread out across an entire trading session. An example would be a large trader putting significant capital to work in the market or taking significant capital out of the market while looking to not disturb that particular market's price and again, being discreet. Same for VWAP but this is measured against the market's volume but accomplishes the same thing.

This is a trading glossary term series of blog posts. You can take a look at all the terms we post with the Trading Glossary label.

Also, visit our Trading Community to learn more about our indepth top down analysis process and trading methodology based on the auction market theory and other closely related nuances.

Monday, September 14, 2015

Initial Balance - Trading Glossary

The price range during the first two periods from the open. The actual definition is far less im-portant than the concept; when the initial balance of the trading range is narrow (reading from high to low) we are more likely to see “range extension”. A wider initial balance will be more stable and better able to contain price.

Some days have no initial balance as the market begins to trend immediately from the opening range with constant range extension. Example of wide initial balance that market could not move above and resulted in reversals.


This is a trading glossary term series of blog posts. You can take a look at all the terms we post with the Trading Glossary label.

Please visit our Trading Community to learn more about our indepth top down analysis process and trading approach.


Volume at Price - Trading Glossary

Footprint/Volume at Price is an indicator that allows the user to see the volume printing within each price bar that is formed. There are many variations to the Footprint such as viewing volume at the Bid vs. the Ask, the Total Volume and the Delta at each price level to name a few. The Footprint was created by Market Delta and other variations of it have been made through other platforms.


A Volume at Price online presentation to understand the basics of this tool as well as chart templates for Sierra Chart are available and accessible for our community members.

This is a trading glossary term series of blog posts. You can take a look at all the terms we post with the Trading Glossary label.

Please visit our Trading Community to learn more about our indepth top down analysis process and trading approach.

Wednesday, September 9, 2015

Short Covering Rally

A Short covering rally would be when the market has sold down to a price level were Higher Time Frame traders either want to take profits or remove some risk, they come into the market and start buying off the open creating a "p" shape profile suggesting we are seeing old business in the market also creating a day type senario.

On the other hand the market might have got too short and with price openeing higher margin calls can force higher time frame market participants to liqudate there inventory creating an "inventory correction".

These types of infomation are key parts to the stories the market is telling us provinding key market generated information.


This is a trading glossary term series of blog posts. You can take a look at all the terms we post with the Trading Glossary label.

Please visit our Trading Community to learn more about our Trading approach.

Poor or Unsecured Highs or Lows

Auctions, within the market’s natural two-way auction process, end in one of two ways:

1) Most commonly the auction ends through a more aggressive counter auction that creates a buying or selling tail; or 2) The auction ends through simple exhaustion. Exhaustion is similar to running up a steep hill and continuing to lose pace or momentum until we just stop and begin to slowly turn around and gradually walk back down the hill. The only thing that stopped us was the loss of our own momentum. By far the most reliable and information packed ending is through aggressive counter action. We refer to an auction that terminated through exhaustion as poor or unsecured because of the lack of counter action; the original auction, after getting a rest, is more likely to make another attempt to crest the hill. The more attempts that are made, the more likely the auction will finally succeed. Poor highs or lows are often the result of excessively long inventory (with regard to poor highs) or excessively short inventory (with regard to poor lows). These inventory imbalances often involve longer-timeframes and therefore take time to balance before continuing in the direction of the prevailing trend.Completion term for visual examples.


This is a trading glossary term series of blog posts. You can take a look at all the terms we post with the Trading Glossary label.

Tuesday, September 1, 2015

Core-Satellite Theory - Trading Glossary

Core-Satellite Theory is traditionally known as an investment strategy that incorporates traditional Fixed Income and Equity based securities (i.e. index funds, ETFs, passive mutual funds, etc.) known as the "core" portion of the portfolio, with a percentage of selected individual securities in the Fixed Income and Equity based side of the portfolio known as the "satellite" portion. The Private Banker has made an adaptation of this definition and applied it to intra-day and swing trading. In this adaptation, the term "Core" refers to being the passively managed portion of a position that has an intended larger target while the "satellite" term reflects the actively managed portion of a position that is scaled in and out to add alpha while actively managing risk.


You can learn more about the Core-Satellite Theory approach in our Trading Education.

This is a trading glossary term series of blog posts. You can take a look at all the terms we post with the Trading Glossary label.