

Friday, February 28, 2020
Intra-day VWAP Update on the ES
The market opened below the value close are from the previous session again. We see a strong bearish market and an one-time-framing lower behavior with quite wide price ranges which occurs for several days now. the market find resistance around the developing VWAP and the DVAL. These levels serving as great entry points in a donwside market for now. There is not much more to say to this particular intra-day VWAP strucutre.

Open Auction Out of Range (OAOR)
Open Auction Out of Range (OAOR) is an open above or below the previous session's range (gap).


This is a trading glossary term series of blog posts. You can take a look at all the terms we post with the Trading Glossary label.
Also, visit our Trading Community to learn more about our indepth top down analysis process and trading methodology based on the auction market theory and other closely related nuances.
Also, visit our Trading Community to learn more about our indepth top down analysis process and trading methodology based on the auction market theory and other closely related nuances.
Thursday, February 27, 2020
Daily Perspective And Yearly VWAP Update On ES
Looking at the plain daily perspective we can observe a strong one-time-framing lower behavior which occurs since 5 days. After breaking several mentioned levels of balance areas the market testing the previous Year's VAH close level which is confluent with the bracket high of the plain weekly balance area. Let's see how the market will react to this particular level as its bearish but kind of rotational in today's session.


Repair - Trading Glossary
Repair is a process in which the market will revisit an area on a profile which lacks symmetry. It is not uncommon to see the market “clean” these areas up. Most times we refer to this process as filling low volume or time areas with volume and time.
Another version of repair is to fill the "empthy" levels (0x0 auctions) of the Footprint once the market sold off or surged higher quickly. Also empty gaps in the lower timeframes after a flash move tend ot be revisted and repaired/filled.

Another version of repair is to fill the "empthy" levels (0x0 auctions) of the Footprint once the market sold off or surged higher quickly. Also empty gaps in the lower timeframes after a flash move tend ot be revisted and repaired/filled.

This is a trading glossary term series of blog posts. You can take a look at all the terms we post with the Trading Glossary label.
Also, visit our Trading Community to learn more about our indepth top down analysis process and trading methodology based on the auction market theory and other closely related nuances.
Also, visit our Trading Community to learn more about our indepth top down analysis process and trading methodology based on the auction market theory and other closely related nuances.
Intra-day VWAP Update On ES
The market opened below the previous value clsoe area and trendling with a downside sope of the VWAP. Currently we found resistance around the developing VAH level. The DVAL could be area of support. Simply monitoring these levels and pattern with we can conclude a trade scenario.


Wednesday, February 26, 2020
Market Update On The E-Mini S&P 500 [Members]
Looking at the daily perspective we can observe a strong one-time-framing lower behavior . The market trades below the Yearly developiong value and heading towards the previous Year’s VAH close level. To be noted is also the prior balance with current support around the bracket low.
You can read the full post on our website as a member here - please make sure to login:
https://leprivatebanker.com/2020/02/26/es-market-update-3/

You can read the full post on our website as a member here - please make sure to login:
https://leprivatebanker.com/2020/02/26/es-market-update-3/

Trading Educational Video Presentations
All Video Presentations which include currently:
You can watch some previews on the webinar page.
– Top Down Technical Analysis (2.5 hours)
– Risk Management (1.5 hours)
– Volume At Price / Footprint (2 hours)
– MIDAS VWAP (55 minutes)
– Market Maker Interview (1.5 hours)
You can watch some previews on the webinar page.
Risk Management Video Presentation
In this Risk Management presentation there will be a discussion around risk management and ways to appropriately handle risk. Also, there are discussion sections that will provide better insight on position sizing and business structure. The goal of this presentation is to remind you of the common pitfalls in trading and ways to overcome them, as well as show you how to approach risk from a professional perspective
You can watch the full presentation here:
https://leprivatebanker.com/webinars/risk-management-presentation/
Here a preview of this presentation:
You can watch the full presentation here:
https://leprivatebanker.com/webinars/risk-management-presentation/
Here a preview of this presentation:
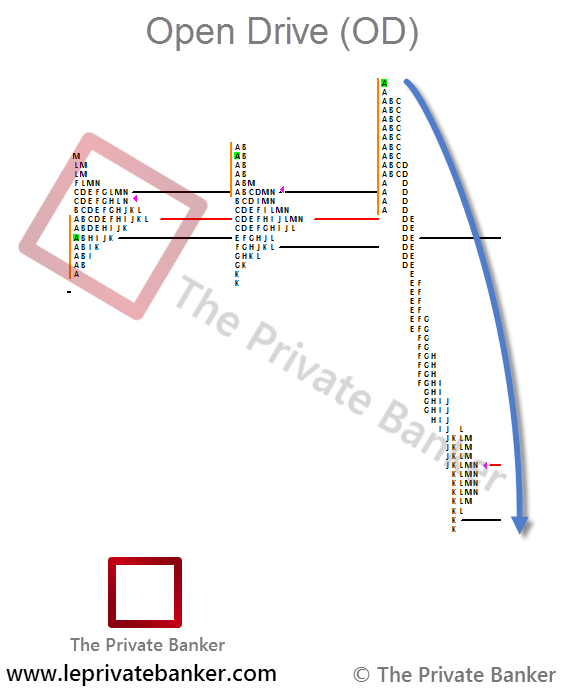
Opening Drive or Open Drive - Trading Glossary
Opening Drive is when the market opens and immediately auctions in one direction without taking out the opening print level. This is the sign of an imbalanced market. However, there is a higher probability in various markets to take out that opening print level later in the trading session.

This is a trading glossary term series of blog posts. You can take a look at all the terms we post with the Trading Glossary label.
Also, visit our Trading Community to learn more about our indepth top down analysis process and trading methodology based on the auction market theory and other closely related nuances.
Also, visit our Trading Community to learn more about our indepth top down analysis process and trading methodology based on the auction market theory and other closely related nuances.
Weekly VWAP Perspective on ES
Looking at the weekly VWAP perspective we can see a wide open below value. The slope is to the downside and the market trades below the developing value. The DVAL, D-VWAP and the DVAH are possible areas of resistance. Curently we can see a swing failure with divergence which could rotate the market higher for now. We'll see which pattern will evolve in the lower timeframes to conclude a trading scenario.


Tuesday, February 25, 2020
E-mini S&P 500 YEARLY VWAP Update
Yesterday the market found support around the mentioned balance area low of the prior daily and the weekly bracket low. Today the market tried its way back into the Yearly developing value but found resistance around the DVAL, therefore the market one-time-framing lower below this year's developing value currently. Maybe the market can close above this Year's low to have a possible swing failure pattern.


Intra-day VWAP Follow-Up Update on ES
As a follow-up from the previous post and the support around the previous VAL close level the market was able to find resistance around the developing VWAP + previous VWAP close level and established a pattern around these levels to get into a short trade. We can use the VWAP and the developing value as a trend-following tool in such a scenario currently.
Next possible area of support would be a prior value close area of the weekly VWAP perspective. Let's see where the market heading towards to.

Next possible area of support would be a prior value close area of the weekly VWAP perspective. Let's see where the market heading towards to.

Intra-day VWAP Update on ES
The market opened below value but surged into the previous value close area followed by a pullback to the developing VWAP with support but found resistance at the DVAH. This pushed the market back to the previous day's VAL close level with current support. Looking at the current structure we can observe a flat slope and a rotational behavior. Resistance around the developing VWAP or DVAH are probable. A rotational destination move to the other side of extreme, in this case the previous day's VAH close level is probable as well. Waiting for some pattern to conclude the next trading scenario.

Follow-up update posted here >>

Follow-up update posted here >>
Naked Point of Control (NPOC)
A Naked Point of Control is an untested point of control, either time based or volume based, that is existent in the current market structure. These can serve as excellent targets for trades as well as potential areas of support and resistance dependent upon the NPOC's profile distribution.


This is a trading glossary term series of blog posts. You can take a look at all the terms we post with the Trading Glossary label.
Also, visit our Trading Community to learn more about our indepth top down analysis process and trading methodology based on the auction market theory and other closely related nuances.
Also, visit our Trading Community to learn more about our indepth top down analysis process and trading methodology based on the auction market theory and other closely related nuances.
TPO Analysis on ES - Double Distribution
Looking at the daily TPO on the E-mini S&P 500 we can observe a double distribution profile with an open inside of value in the lower distribution. The market found support at the excess low and surged to the higher extreme of the mentioned distribution. To be noted is the current unsecured swing high which could be revisted.
There are three possible scenarios - a rotational behavior inside of the distribution - a break higher to fill the low volume area - and a break lower to continue the sell off movement. Volume based we can identify a b-shaped profile which should be handled as a bullish pattern but we opened inside of value, therefore its better to see how the market will react around the balance/distribution extremes.

There are three possible scenarios - a rotational behavior inside of the distribution - a break higher to fill the low volume area - and a break lower to continue the sell off movement. Volume based we can identify a b-shaped profile which should be handled as a bullish pattern but we opened inside of value, therefore its better to see how the market will react around the balance/distribution extremes.

E-mini S&P 500 Market Observations
Starting off with the weekly perspective we can see a balance area which established yesterday. The market found support at the bracket low. The daily perspective found support at the bracket low in the prior balance area after the sell off. The market trades around the Yearly developing VAL level of the VWAP (-1.0 Standard deviation). It opened below that particular level, therefore it could be seen as a resistance level as well.
The full article has been posted on our website for members. You can read it here - please make sure to login:
https://leprivatebanker.com/2020/02/25/market-observations-on-es-4/

The full article has been posted on our website for members. You can read it here - please make sure to login:
https://leprivatebanker.com/2020/02/25/market-observations-on-es-4/

Monday, February 24, 2020
ES Intra-day VWAP Market Update
The market opened with a gap down and trends lower in a rotational behavior with a downside slope. We can identify a distribution in the lower area of today's ETH price range in which the market trades between the extremes. In the middle of this particular distribution we can observe a LVN area which support or resistance based on the above/below location of the price. We can expect resistance around the VWAP and the DVAH as well as possible support at the DVAL now. Monitoring for any pattern to conclude a trading scenario.


ES testing YEARLY VWAP DVAL
Looking at the Yearly VWAP on a daily perspective we can observe that the market testing the Yearly developing VAL level (-1.0 Standard Deviation level) of the VWAP. We can also observe that the market trades inside of a prior balance area. We monitor any reaction around the DVAL and the bracket low of this particular balance area.


Download Sierra chart Templates [CHARTBOOKS]
As a member you can download some of the new and simple Sierra Chart Templates or Chartbooks from our website. The new templates includes 7 charts:
Take a look at our chart templates page on our website - make sure to login:
https://leprivatebanker.com/chart-templates/

Plain Weekly
Plain Daily with VWAP
TPO/Volume Profile
Weekly VWAP
Daily VWAP
Footprint
DOM
Take a look at our chart templates page on our website - make sure to login:
https://leprivatebanker.com/chart-templates/

Excess - Trading Glossary
Excess indicates the end of one auction and the start of a new auction. It is visible through buy-ing and selling tails (single TPO prints). Excess occurs in all timeframes; it completes an auction. There are always multiple two-way auctions at work; one could be completed while another is still active. As was previously mentioned, balance and excess are the two most important concepts you will be introduced to because they show change or the possibility for change to take place.


This is a trading glossary term series of blog posts. You can take a look at all the terms we post with the Trading Glossary label.
Also, visit our Trading Community to learn more about our indepth top down analysis process and trading methodology based on the auction market theory and other closely related nuances.
Also, visit our Trading Community to learn more about our indepth top down analysis process and trading methodology based on the auction market theory and other closely related nuances.
How to READ the Commitments of Traders (COT) Report
I thought it would be a good idea to explain how I personally reviewing the weekly CFTC Commitments of Traders (COT) report especially for Crude oil. First thing to note is the very fact that the analysis of this report is only one aspect of the whole analysis process and serves as corroboration of what I am seeing in the market.

You can read the full article of this post as a member on our website. Read the full HOW TO article here.

You can read the full article of this post as a member on our website. Read the full HOW TO article here.
COT Report for WTI Crude oil as of February 18
The managed money sector net sold 26.687 contracts of WTI Crude oil as of February 18 (Options and Futures combined) with a long liquidation of 15.326 contracts and 11.261 short position contracts got into the market. Looking at the net hold postions we can observe a decrease since January.

You can see the full details here: https://www.cmegroup.com/tools-information/quikstrike/commitment-of-traders-energy.html

You can see the full details here: https://www.cmegroup.com/tools-information/quikstrike/commitment-of-traders-energy.html
How to ANCHOR the VWAP - MIDAS VWAP Presentation
The MIDAS Vwap Presentation walks through the basics of the tool’s utilization as well as its applications to help in understanding the market’s underlying order flow from balance to imbalance though algorithmic execution. The MIDAS Vwap tool is a unique and powerful way of looking at the markets that may help add an extra edge to a trading method when combined with other key elements.
Here is a quick preview of this particular presentation. You can watch the full video presentaion on our webiste as a member.
Here is a quick preview of this particular presentation. You can watch the full video presentaion on our webiste as a member.
How to READ the FOOTPRINT TOOL [Volume at Price Presentation]
The Volume at Price video walks through the basics of the tool’s utilization as well as its applications to help in understanding the market’s underlying order flow. The Volume at Price tool is a unique and powerful way of looking at the markets that may help add an extra edge to a trading method when combined with other key elements.
Here is a preview of this particular presentation. You can watch the full presentation on our website.
Here is a preview of this particular presentation. You can watch the full presentation on our website.
Market Update on the E-Mini S&P 500
Starting off with the daily perspective we can observe a gap down open inside of the Yearly developing VWAP value area. The destination move could be the developing VAL level. Currently the market trades inside of the prior balance area. The middle or the low of this bracket should be level to monitored.

The full post has been posted for members on our website. You can read the full article there.
Read the full Market Update on ES here >>

The full post has been posted for members on our website. You can read the full article there.
Read the full Market Update on ES here >>
Subscribe to:
Posts (Atom)